
#4 The Truth About Temperature and Fermentation Speed
Not all temperature readings predict fermentation speed equally. Average container temperature is nearly useless, while early ambient readings and peak-moment temperature carry real signal — a finding that directly shapes how SourFriend predicts peaks.

Misconceptions About Temperature
"The higher the temperature, the faster the fermentation."
Anyone who has studied fermentation knows this basic principle. Yeast and lactic acid bacteria become more active as it gets warmer. That's why many people pay close attention to kitchen temperature, knowing from experience that fermentation is faster in the summer and slower in the winter.
However, while analyzing our data, we discovered something quite unexpected.
How Temperature is Measured Matters
Sourfriends records two types of temperature simultaneously.
Internal Container Temperature The temperature inside the jar holding the starter. The device controls this directly based on the fermentation stage. It stays around 26°C in the early stages and drops below 10°C once it switches to cooling mode after the peak.
Ambient Kitchen Temperature The temperature of the air surrounding the device. It varies widely from 8°C to 41°C depending on the user's living environment.
So, which temperature is more closely related to fermentation speed?
The 'Kitchen Weather' Even Machines Can't Control
When building a product, we often encounter strange signals from data. For our team working on machine learning models to predict the fermentation peak time, the average internal temperature of the device was exactly one of those signals. It seemed like the most critical piece of data, but oddly enough, it was completely useless for peak prediction.
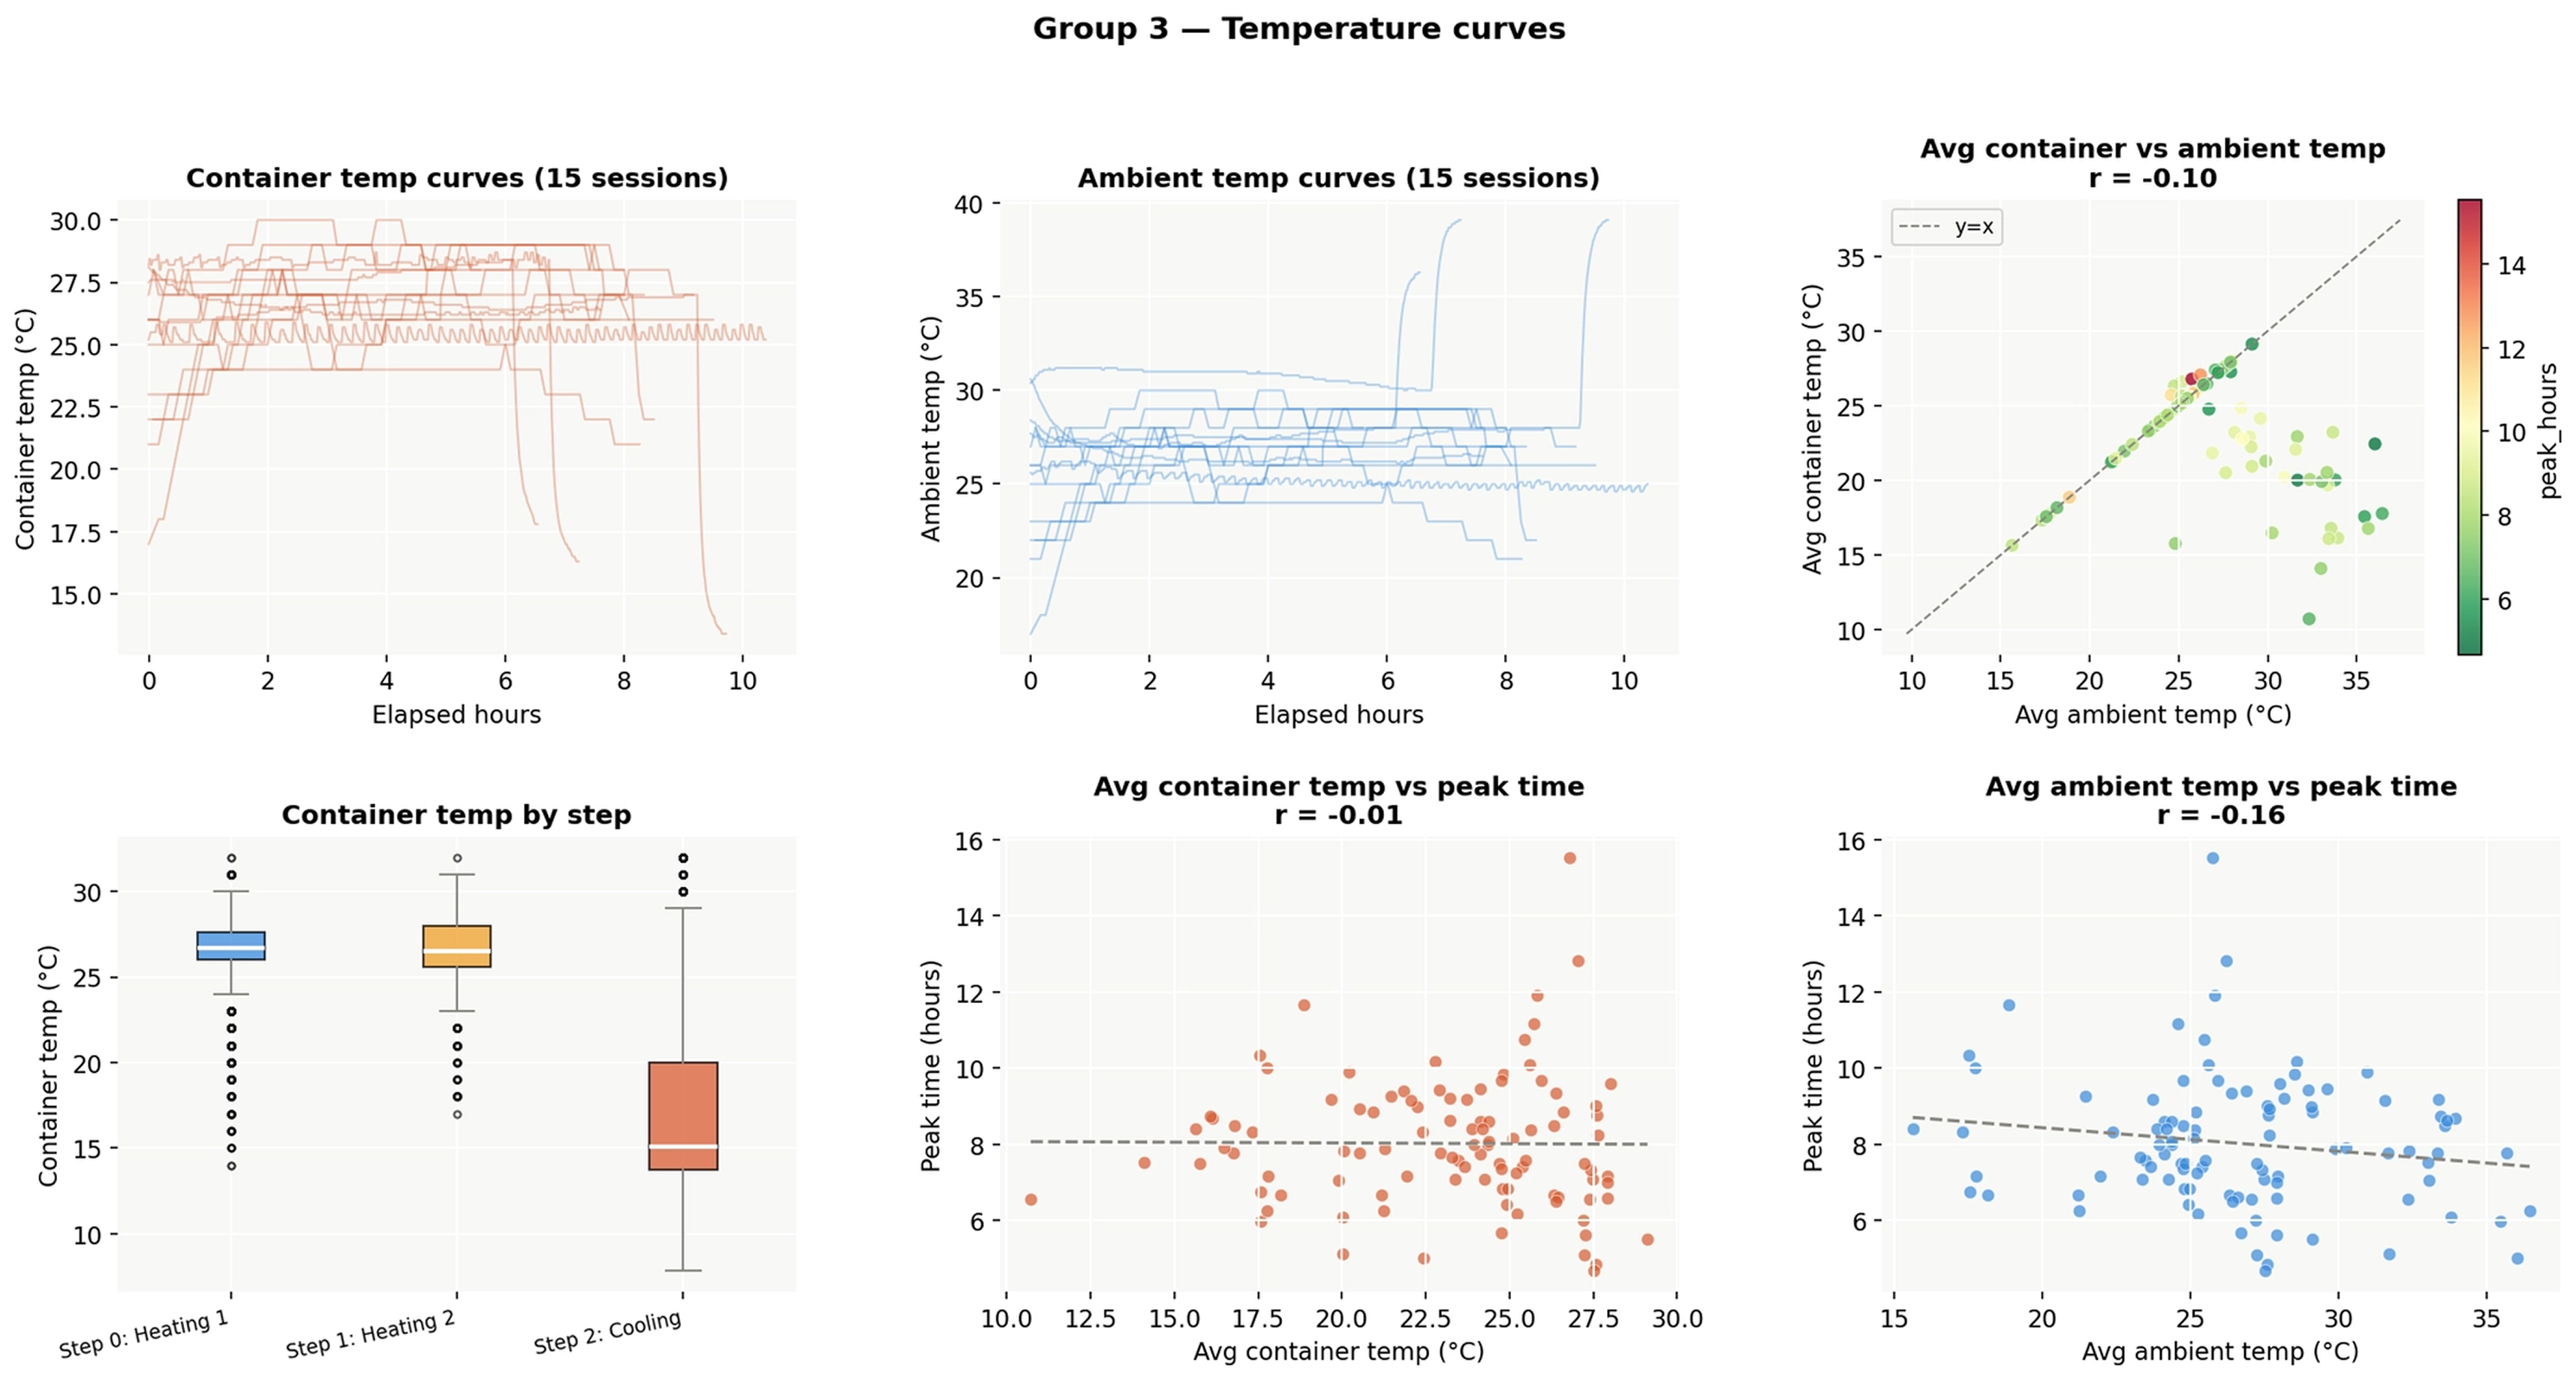
Only after opening the boxplot graph did we realize the real reason.
1. Scripted 'Noise' vs. Living 'Signal'
The internal container temperature (containerTemp) was actually a thoroughly controlled play. The device precisely adjusted the temperature stage by stage (keeping it warm at 26°C in the A1 stage, and chilling it to 15°C in A3).
"Data that is perfectly controlled by a machine is nothing but noise to a predictive model."
On the other hand, there was a realm the device couldn't touch: the user's kitchen temperature (ambientTemp). Ranging from a chilly 8°C in a winter veranda to a scorching 41°C next to a summer stove, this raw, uncontrollable environmental data was the real 'signal' shifting the biological rhythm of the microbes.
2. The Peltier Paradox: Why the Outside Warms Up as the Inside Cools Down
Looking at the correlation coefficient between the internal and external kitchen temperatures, it pointed in opposite directions (r = -0.39). Conventional wisdom suggests the inside should be warm when the kitchen is warm, so why did it move in reverse?
The secret lay in the Peltier element responsible for cooling. When the device aggressively triggers its cooling function to bring the internal temperature down to 15°C (A3 stage), the Peltier element vents that exact amount of heat outside the device. Consequently, as the inside cools down, the surrounding kitchen temperature paradoxically becomes warmer—combined with seasonal factors like the absence of air conditioning, drawing a curious negative slope (r = -0.10).
In essence, the 'kitchen weather' that pierces through the machine's control was the hidden key determining fermentation speed.
"The temperature at the fermentation peak" became a powerful hint for us. Sessions with lower temperatures at the peak time progressed much slower, leading to a longer overall fermentation time.
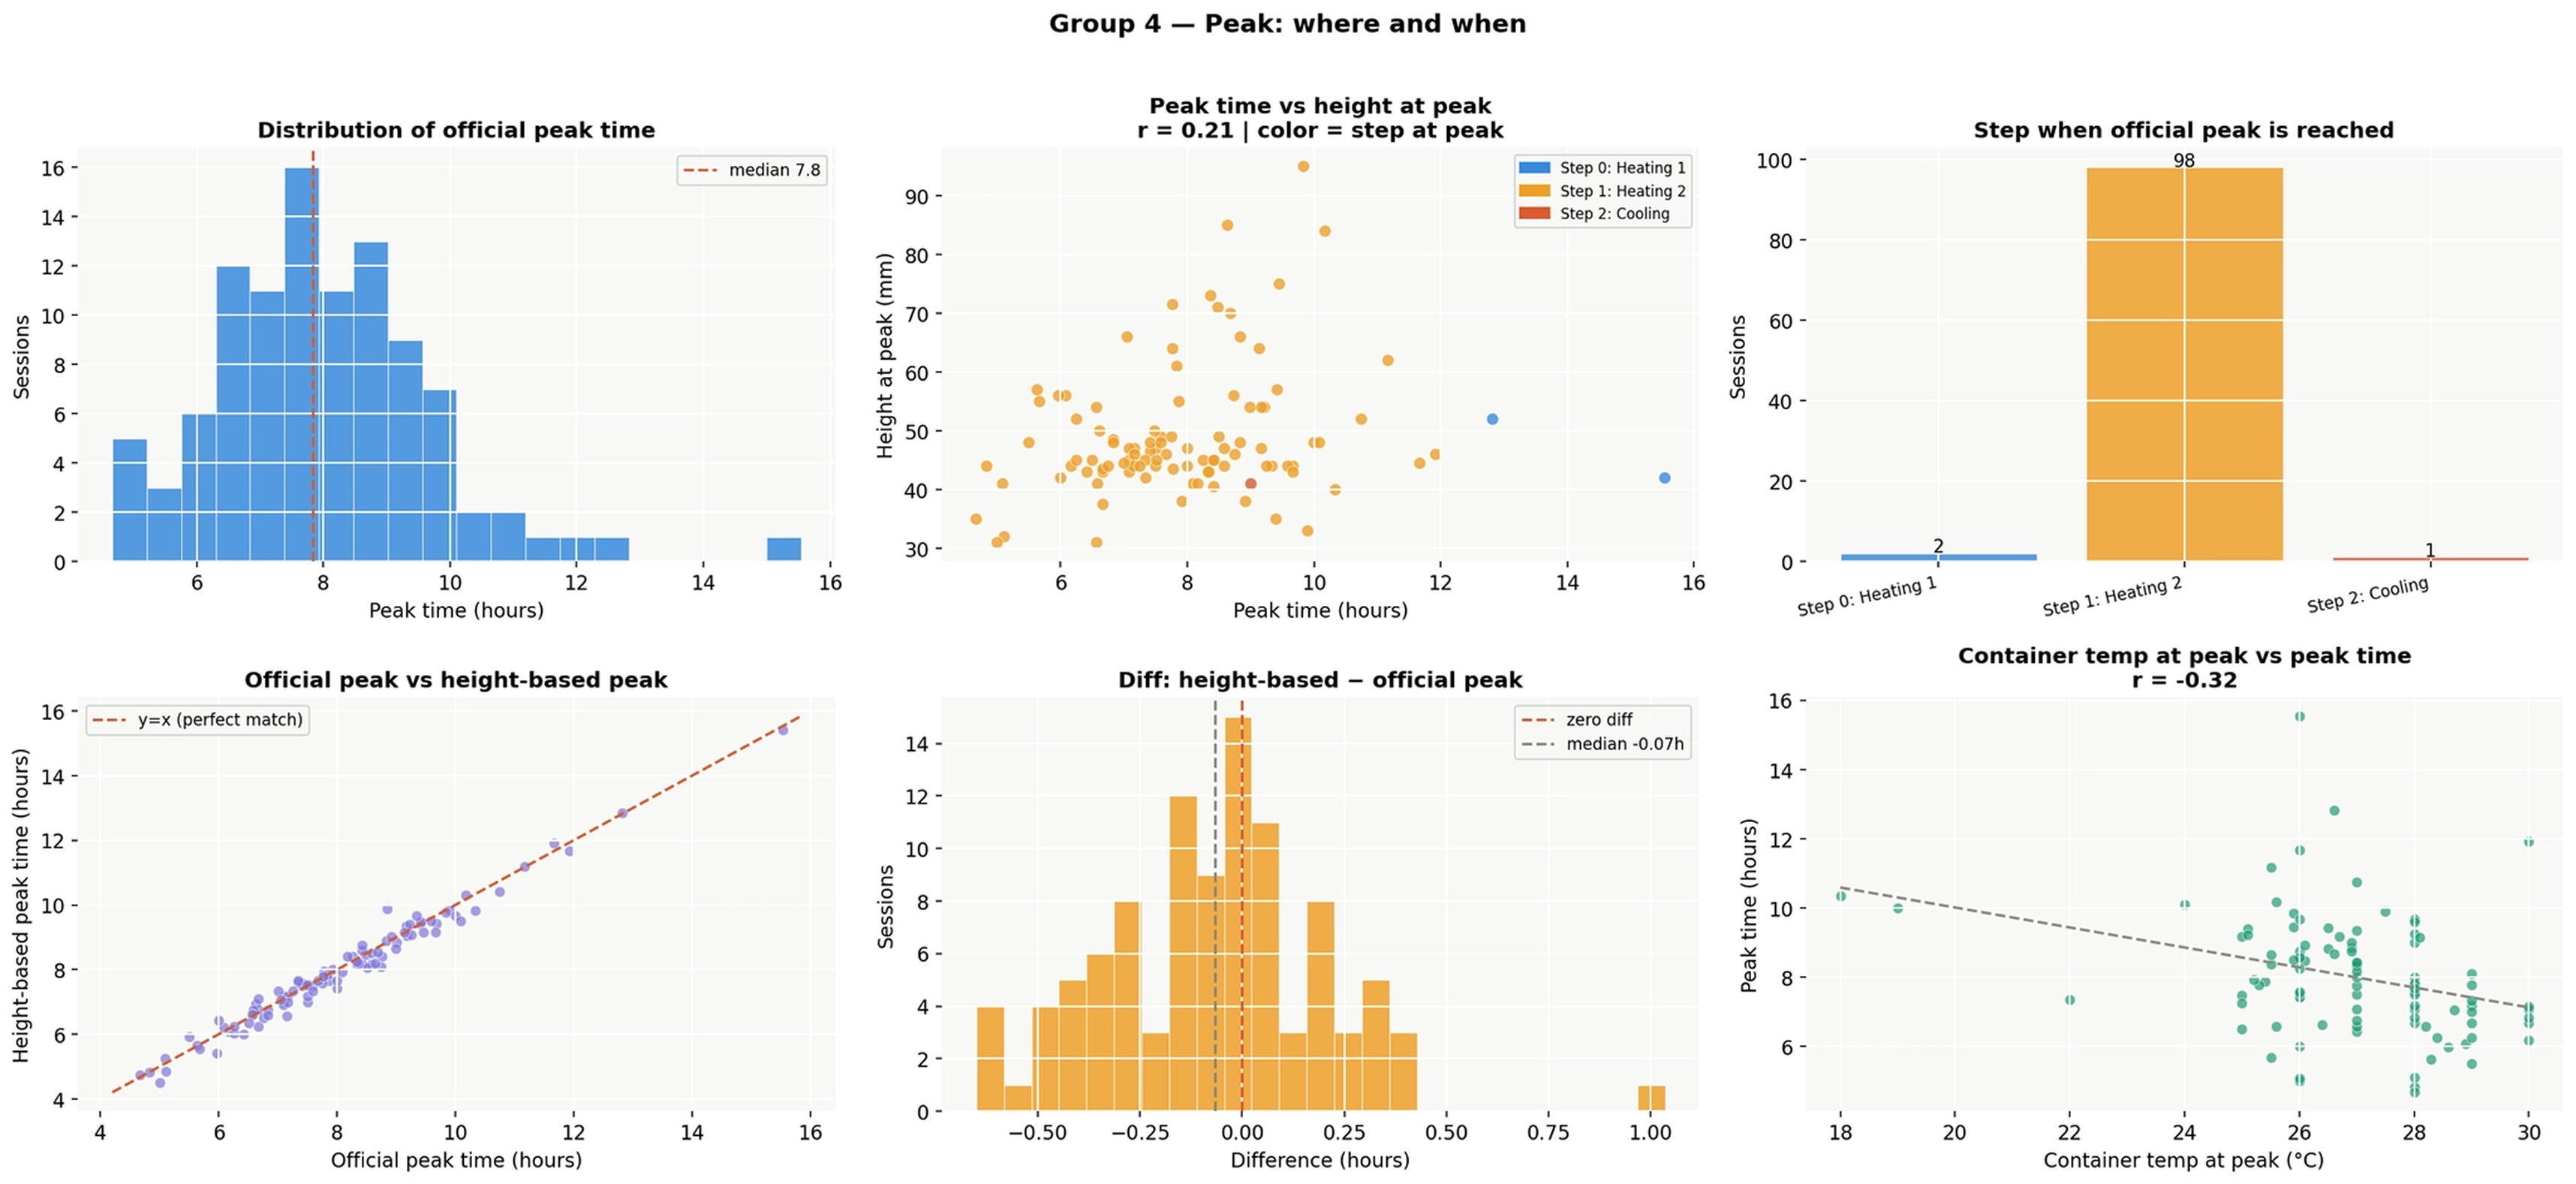
In other words, the peak temperature is an indirect indicator of how slowly the fermentation progressed. Of course, the peak temperature cannot be known before the peak actually happens. For us, who need to predict the time in advance, it was like a pie in the sky.
So, we found a clever workaround.
The 'First 1–2 Hours' That Predict the Answer
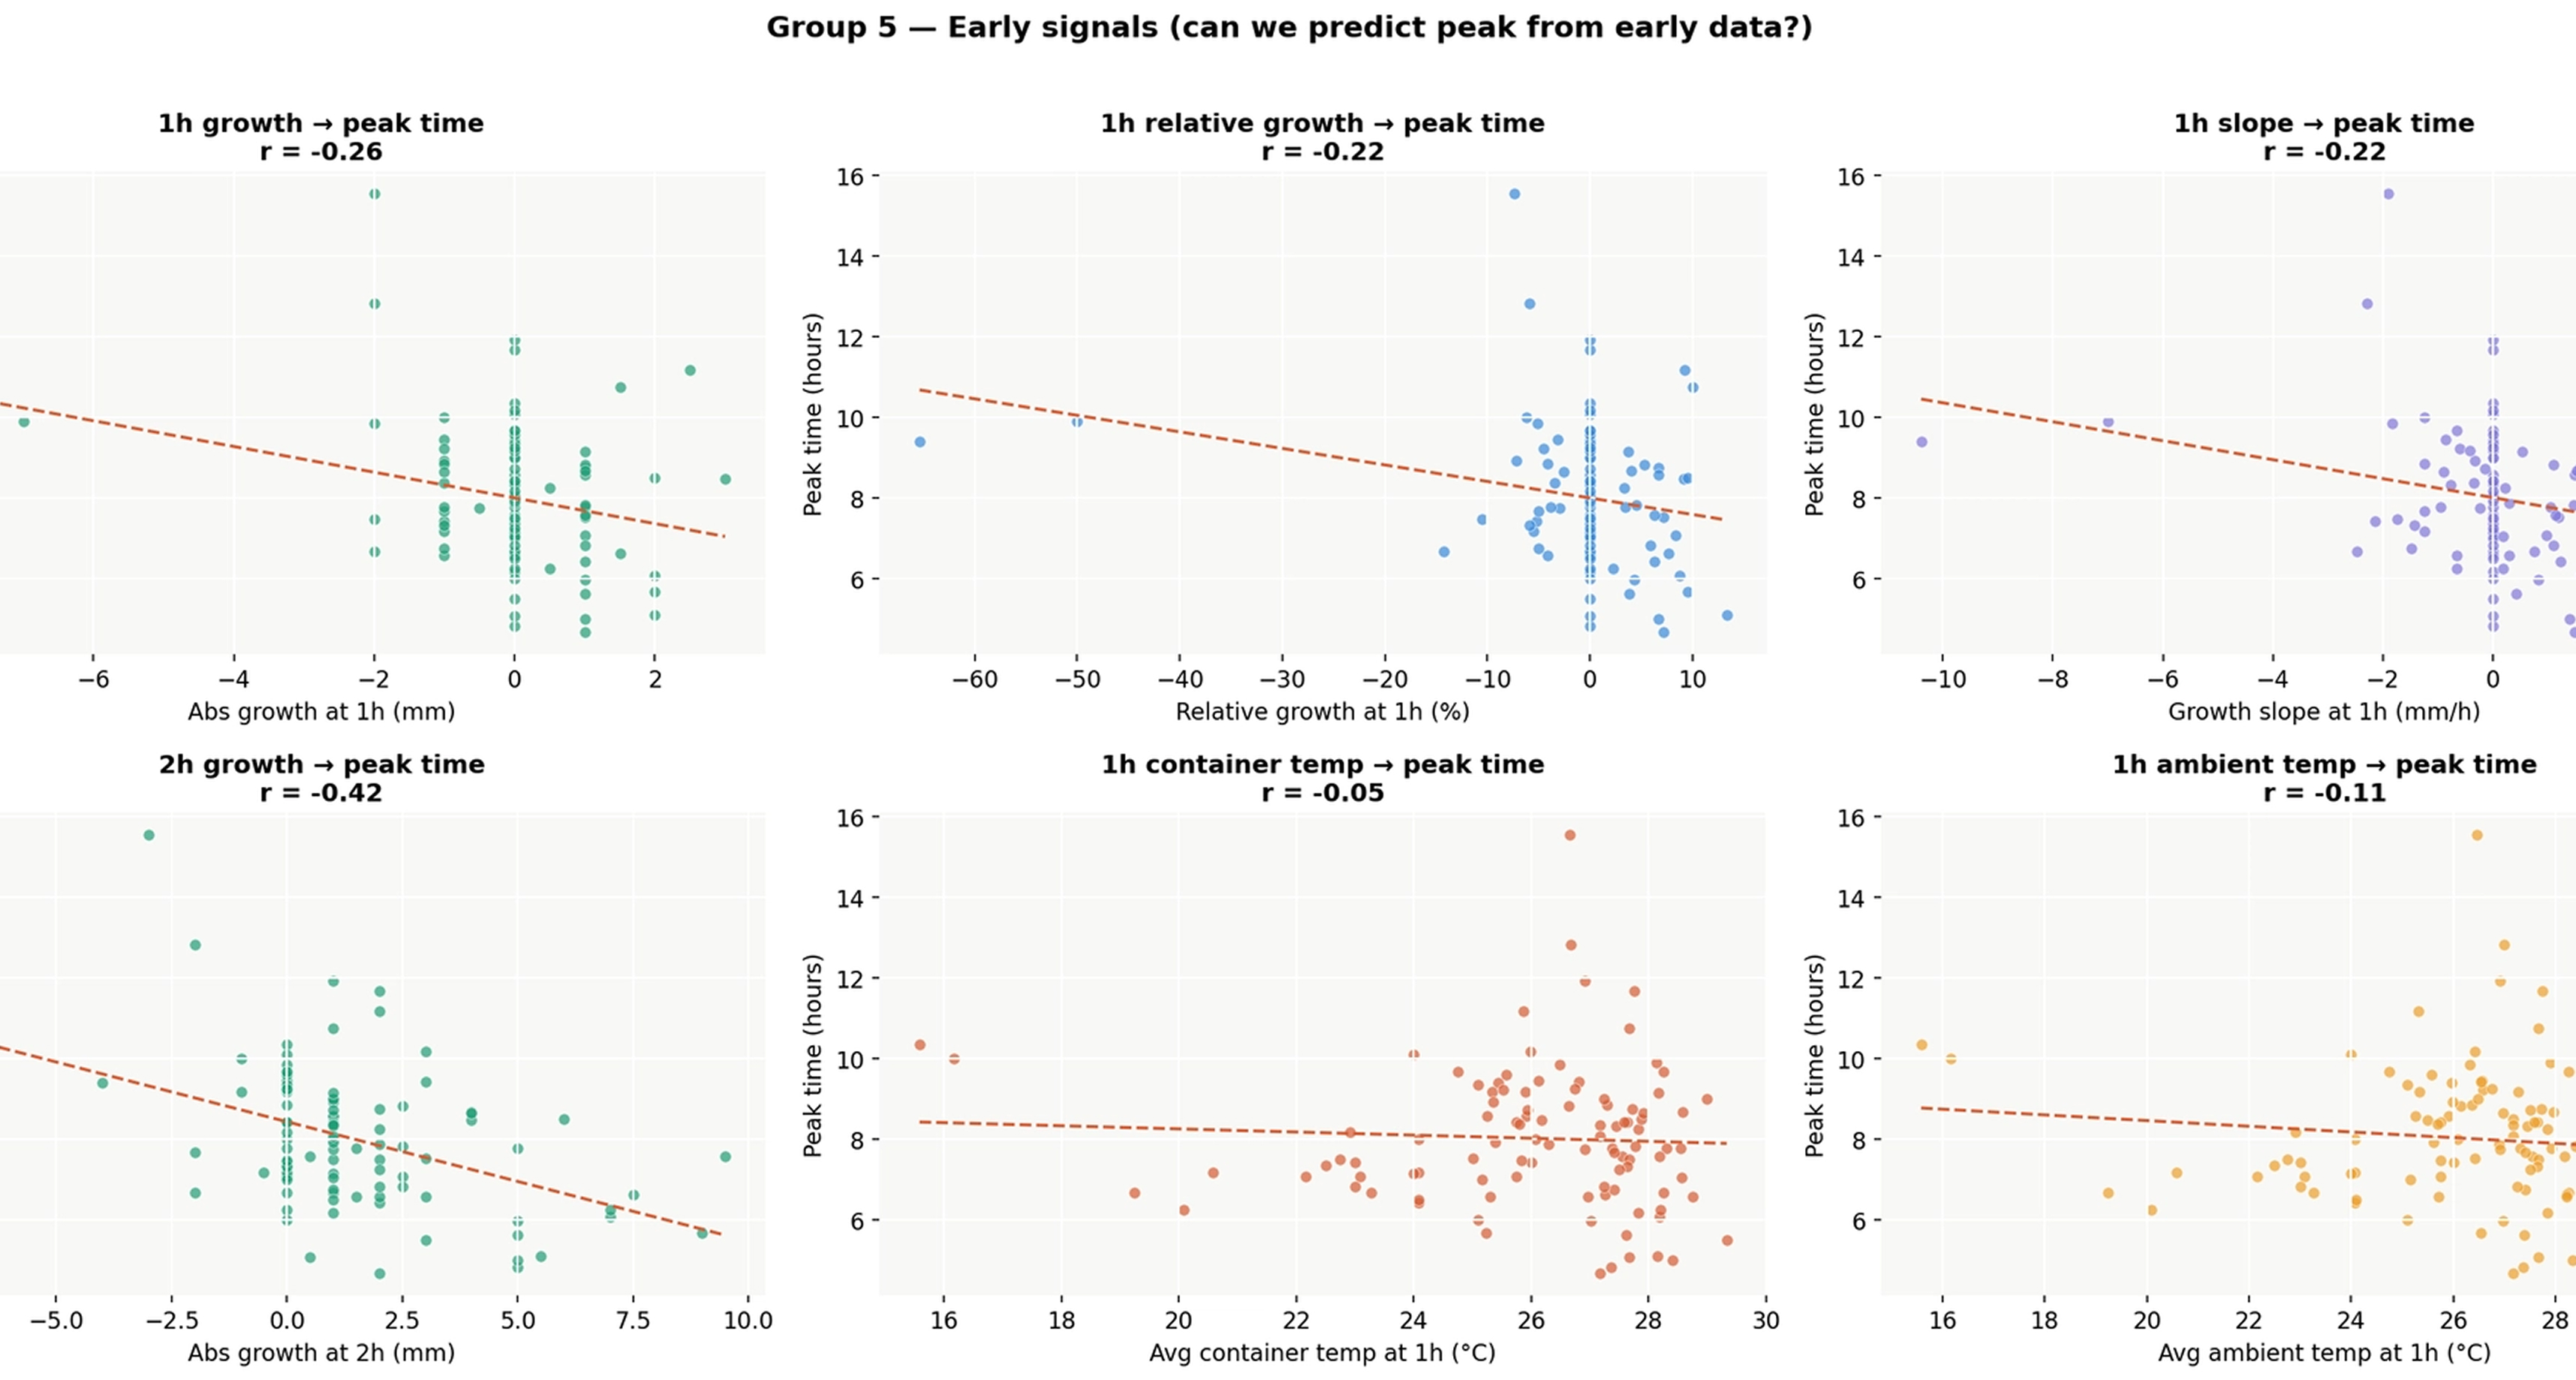
If we can't take a time machine into the future, we decided to put the 'first 1 to 2 hours of the start' under a magnifying glass. Just as you can estimate a marathon runner's total record by watching their pace in the first 5 minutes, looking at the trend and slope of the temperature rise in the first 1–2 hours sent us a signal that foretold the subsequent fermentation speed.
What This Actually Means
If you thought, "The device handles the temperature automatically, so it should be fine," while using Sourfriends, you are half right.
We manage the inside of the device. However, we cannot control your kitchen environment. A kitchen without an air conditioner in the peak of summer and a kitchen with the heater turned on in the dead of winter will result in completely different fermentation paths, even with the same settings.
That's why our predictive model reads the kitchen temperature too. We must consider variables beyond our reach to tell you the peak time more accurately.
Not being fooled by generalized average numbers. Constantly and fiercely focusing on the uncontrollable surrounding environment and the subtle initial flows. That is how Team Toasterz uses data to evolve our product more intelligently.
Concluding the Series
Over four episodes, we have shared what we discovered in our fermentation data. To summarize:
- There are three patterns in fermentation, and they all follow an S-curve.
- The growth rate in the first 2 hours is the strongest signal predicting the peak.
- Temperature becomes entirely different information depending on which point in time you look at it.
All of these discoveries ultimately lead to a single feature.
About 2 hours after starting fermentation, Sourfriends telling you,
"Today's peak will likely arrive around 3 PM."
Sourfriends is evolving every day by accumulating vast amounts of fermentation data to find the real signals hidden behind generalized numbers. What will Toasterz's next journey of proving answers through data look like? Don't miss out on the stories to follow!